
01.02.2025
Inequality Before the Law
Investigating bias in the world’s most vaunted criminal justice system.
Published with

INVESTIGATION
Norway ranks as one of the world’s most equal societies. It has one of the smallest Gini coefficients — a common measure of income inequality — worldwide and leads gender equality indexes.
Praise extends to the country’s criminal justice system, which has been lauded by justice reform advocates. In the World Justice Project’s annual rule-of-law index, Norway has consistently appeared in the top three of the criminal justice system category, which assesses impartiality, due process and effectiveness. It has one of the world’s lowest two-year recidivism rates — which latest figures place at just 17 percent — and its emphasis on rehabilitation has been showcased by the American documentary filmmaker Michael Moore, among others.
Norway’s criminal justice system also maintains broad public confidence. In a 2022 survey, 87 percent of respondents reported having very high or fairly high trust in the nation’s courts.
Data-driven criminal justice reporting in Norway has been scant. It is emblematic of a larger gap within Europe, where criminal justice reporting is a lower priority for investigative journalists compared to the United States and Latin America. In multiple European countries, reporters face considerable difficulties accessing usable data. Verdicts are not always easily obtainable, and even when they are available, they are often fully anonymized, making it difficult to conduct independent analyses of sentencing patterns for different demographic groups.

Norway is an exception. Verdicts are not pseudonymized and authorities make demographic data on residents available to journalists. Journalists at NRK, Norway’s national broadcaster, obtained court verdicts in order to build a dataset of cases, defendants and judges.
Lighthouse partnered with NRK in order to understand whether defendant and judge demographics were associated with harsher or more lenient sentences. In other words, we wanted to understand whether who you are — or who your judge is — makes a difference in one of the world’s model criminal justice systems.
We found that certain defendant and judge demographics are associated with longer prison sentences — even when accounting for the crimes committed and aggravating factors. Who you are and who your judge is can impact the sentence you receive.
In particular, our findings point to stark class injustice within Norwegian courts. Lower-income defendants receive substantially longer sentences than wealthier defendants. Women also receive shorter sentences than male defendants.
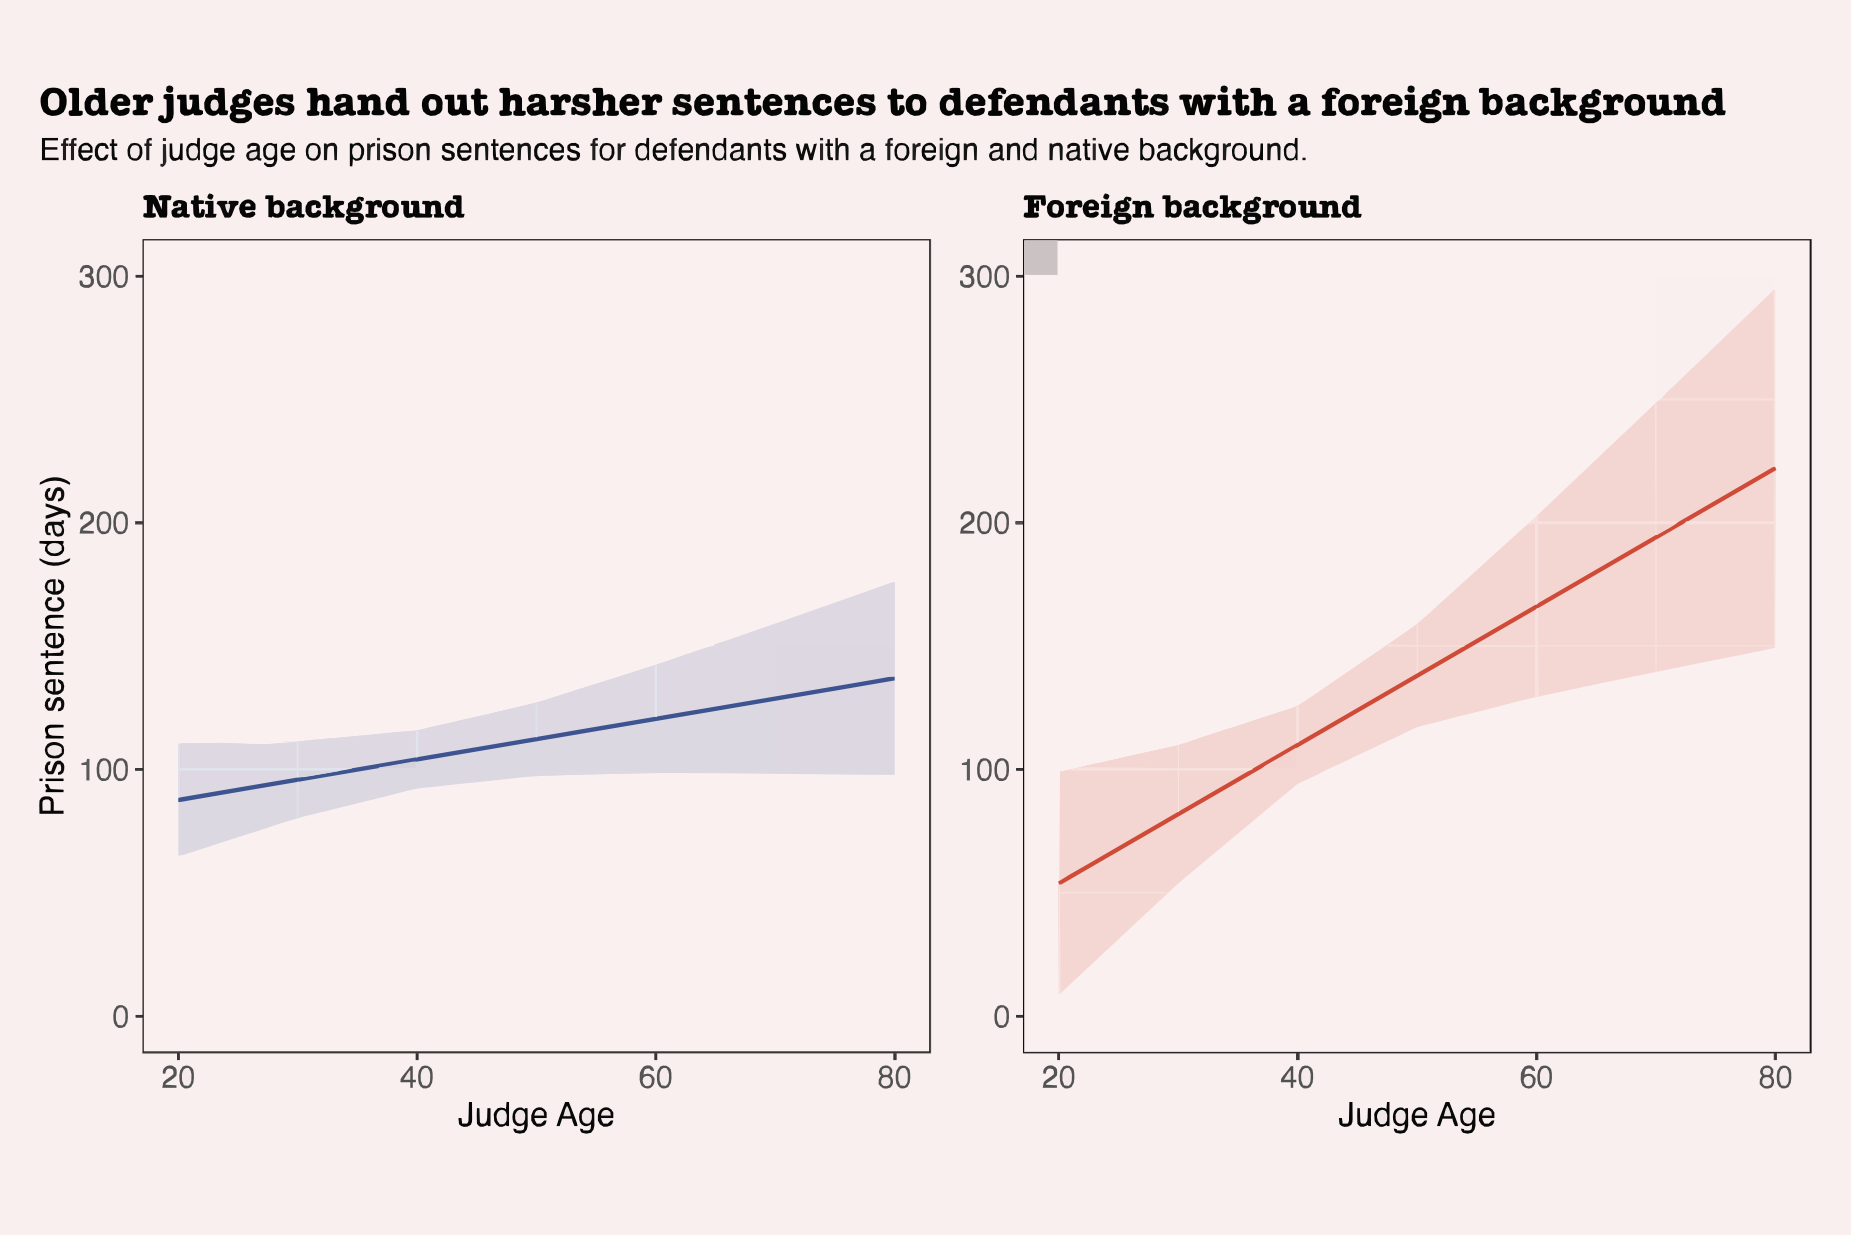
Judge demographics can matter, too. Older judges hand out significantly longer prison sentences than younger judges — and they sentence defendants with a migration background particularly harshly.
Our analysis was limited to sentencing. Criminal justice systems contain a far wider set of interactions, including policing, arrest patterns, prosecutorial charges and release decisions. These are outside the scope of our analysis, although we encourage journalists both in Norway and elsewhere in Europe to investigate bias in these interactions, too.
The underlying code and results of our analysis are available on Github. Given European laws around data protection and societal norms around privacy in relation to criminal proceedings, we have decided not to publish the dataset underlying this analysis.
In 2022, NRK set out to build a database that would allow it to better understand Norway’s lay judge system. In Norway, criminal cases in the first instance are typically heard by a panel composed of one professional judge and two lay judges. A lay judge does not need a legal education and is meant to represent the public in a court of law. However, unlike a juror in the United States, lay judges are not randomly selected but rather volunteer and are then appointed by a local municipal council. NRK ultimately found that lay judges are older, wealthier and ‘more Norwegian’ than the public they are intended to represent.
Even though this analysis is not focused on lay judges, we used the same database. The sample of our investigation is district court cases that involve lay judges. Criminal cases that involve questions of guilt, as well as cases that involve alleged victims, are typically heard by lay judges. Cases where a defendant has fully confessed to all charges, as well as restraining orders and confiscation of driving licences are typically heard by one professional judge and therefore are not in our dataset.
Norway does not have a publicly accessible database of defendants and verdicts at the district level. However, individual district courts make verdicts available to journalists for three months after publication.
From March 2022 to December 2023, we collected new verdicts to build a database. The final database contained 9,019 verdicts. According to the Norwegian Courts Administration, 18,449 verdicts of this type were delivered between the beginning of 2022 and the end of 2023.
We were unable to obtain the entire set of verdicts for the following reasons:
– In some cases, courts prohibit public disclosure of a verdict.
– An old IT system can cause errors when employees upload judgments.
– Some district courts reported a lack of training, resources, or protocols for publishing verdicts.
Random checks previously conducted by the Oslo District Court found that its clerks had only published half of its verdicts, which roughly corresponds to what we have obtained. Oslo’s District Court investigation into why verdicts were not being published did not find any systematic bias in which verdicts were uploaded or not uploaded.
We standardized the data extracted from each court record. First, we extracted the name and year-of-birth for defendants and judges from the verdicts. We then cross-referenced this with Norway’s national tax list, which contains the total net income, tax paid and postal code for all individuals who have paid taxes in Norway. Finally, we used a combination of name and postcode to query Norway’s population register, which makes demographic data about Norwegian residents available to journalists. For a more detailed explanation of how we built our dataset, see Appendix I.
We obtained the sections of the Norwegian criminal code under which defendants were accused and convicted via the verdicts, where they are outlined in a standard format. However, our dataset still lacked the aggravating and mitigating factors that can lead to harsher or more lenient sentencing. For example, if a defendant has been previously convicted of the same type of crime, this can be considered an aggravating circumstance. Meanwhile, a confession can be considered a mitigating circumstance.
Verdicts did not consistently detail aggravating or mitigating circumstances in a standardized way. We ultimately used a combination of pattern matching (regex) and OpenAI’s GPT-4 API in order to identify aggravating and mitigating circumstances. The results were benchmarked using a manually labeled random sample. For a more detailed explanation, see Appendix II.
The table below describes the four different groups of variables in the resulting dataset. For a more detailed breakdown of each variable used in the analysis, including its distribution, see Appendix III.
There are a number of possible outcomes for defendants criminally convicted in the Norwegian criminal justice system, including prison time, fines, or community service. Defendants can also be given a probationary sentence, or a subsidiary sentence that is only served if they fail to pay a fine. We focused on prison sentences for our analysis, although we also tested each of the other outcomes as well. If a defendant was convicted of a crime that carries a potential prison sentence but did not receive any prison days — because, for example, they received a probationary sentence — we set the sentence to zero.
We first calculated average sentence length across each of the demographic subgroups. In other words, we subdivided our dataset by men and women or people with and without a foreign background and computed the average sentence length, as well as other summary statistics for each demographic group.
However, being charged or convicted for certain crimes can be correlated with demography. Imagine, for example, that all the women in our dataset were convicted of theft while all the men were convicted of armed robbery. In that case, we would expect men to receive much longer sentences on average. And the difference in the severity of punishment would not be an indication of sentencing bias but simply reflect the severity of the crimes.
To deal with this problem and isolate the impact of demographic factors on sentencing we used linear regression analysis. Regression analysis allows us to control for all demographic variables, individual sections under which defendants were convicted, and mitigating and aggravating circumstances. In other words, we can identify the association between gender and prison sentence length while holding constant the defendants’ age and income, the crimes they are accused of, and whether they have confessed to the crime or are a repeat offender.

Where Y is the harshness of a sentence of defendant i (e.g., the number of prison days) and DEM is the demographic variable of interest. X is a vector of other defendant demographic characteristics and Zj is the equivalent vector of the professional judge’s demographics while γi accounts for criminal section specific and δi for aggravating and mitigating factors’ fixed effects. Standard errors are clustered at the judge ID level to account for the fact that errors may be correlated for the same judge.
We ran a number of different regression models with varying control specification and a logged version of prison days that softens the effect of very long sentences. For a more detailed discussion on our robustness checks, see Appendix III.
We wanted to avoid a situation in which exceptional cases skewed our analysis and results. We therefore dropped all cases with an aggravating or mitigating circumstance, or a conviction under a section, that occurs less than 50 times in the dataset. This means that especially rare and egregious crimes, such as first degree murder, are excluded from our dataset. After all these exclusions, we were left with 5,224 cases.
Our reporting focused heavily on results that are robust to various modeling approaches and the full set of controls. This methodology reports results from regression models computed using a filtered version of the dataset that only contains defendants who received a prison sentence. It reports from models using three levels of controls:
– No controls.
– Demographic controls: Controlling only for defendant or judge demographic variables, such as age and gender.
– All controls: Controlling for both defendant and judge demographic variables, specific convictions, and aggravating and mitigating circumstances.
We first wanted to understand whether defendant characteristics were associated with disparate sentencing outcomes. Across all demographic characteristics, we saw substantial differences in average prison sentences and fines.
When we analyzed differences with a regression model controlling for demographic characteristics, sections of the criminal code, and aggravating and mitigating circumstances, some of the differences that can be seen in the graph above were no longer statistically significant.
Overall, we found that:
– Log Income: Wealthier defendants receive shorter prison sentences, even when controlling for other factors. This difference is statistically significant.
– Gender: Women receive 35 days fewer in prison than men on average. When controlling for other factors, women receive 24 days fewer than men — this amounts to an 8.7 percent shorter sentence.
– Age: Without controlling for other factors, defendant age has an insignificant effect on the length of prison sentences. When controlling for other factors, age becomes significant and defendants receive almost an additional day of prison time for every year of age.
– Foreign Background: Defendants with a foreign background receive an additional 15 days in prison compared to Norwegian defendants on average, but there is no statistically significant difference when controlling for other factors.
We wanted to understand how some of the disparate sentencing patterns we found play out at the level of individual crimes. We picked driving under the influence of drugs because we found large sentencing disparities between low and high income defendants.
Norway’s traffic laws stipulate a recommended sentence tied to a defendant’s blood alcohol content (BAC). For cases where a defendant is charged with driving under the influence of drugs, an equivalent blood alcohol content is often calculated via lab testing.
– Defendants with a BAC of less than 0.5 should receive a fine.
– Defendants with a BAC between 0.5 and 1.2 can receive either a probationary or unconditional prison sentence depending on circumstances of the case.
– Defendants with a BAC of above 1.2 should receive an unconditional prison sentence.
We found that defendants in the lowest income quantile received prison sentences that are, on average, twice as long as sentences handed to defendants in the highest income quantile.
Despite this, the share of defendants with an equivalent blood alcohol percentage above 1.2 is nearly identical between the lowest and highest income quantile. Meanwhile, the share of defendants in the third income quantile with a BAC above 1.2 is higher than all other quantiles.
Norway’s traffic laws recommend that defendants with a BAC above 1.2 who are convicted for driving under the influence should receive an unconditional prison sentence. Nonetheless, Norwegian judges are given broad discretion and can decide to hand out a probationary sentence.
Amongst defendants convicted for driving under the influence with a BAC above 1.2, higher income defendants were more likely to receive a probationary sentence than lower income defendants.
We ran a regression model for driving under the influence of drugs cases, which, in addition to the full set of controls discussed earlier, also included the defendant’s (equivalent) blood alcohol percentage and the type of drugs, such as cannabis or cocaine, that they had allegedly consumed before driving. Across all of our four different specifications, defendant income remained a statistically significant predictor of the length of a defendant’s prison sentence.
We were not just interested in the correlation between defendant characteristics and sentencing outcomes. We also wanted to understand whether the demographics of the three judges in each case — two lay judges and one professional judge — had an impact on sentencing patterns.
We ultimately decided to focus on the impact of professional judges’ characteristics. When analyzing the impact of all three judges’ demographics on sentencing outcomes, we found that effects were largely driven by the professional judge’s demographic characteristics.
We first looked at the median differences in sentences across different judge demographics. With the exception of older judges, we found only small differences.
Similar to our analysis of defendant characteristics, we also analyzed differences using a regression model while controlling for demographic characteristics of judges and defendants, sections in the criminal code, and aggravating and mitigating circumstances.
Overall, we only found one statistically significant difference when it came to prison sentences: Older judges hand out longer sentences, even when controlling for other factors. Every additional year of age is associated with 1.7 days of additional prison time. In other words, a judge who is 65 will, on average and holding all other factors constant, hand an additional 51 days of prison time compared to a judge who is 35.
We were interested to understand which defendants older judges were handing out longer sentences to. When we restricted our dataset to only defendants with a native background, judge age did not have a significant effect on sentencing and each judge year only increased sentence length by around 0.8 days. But when restricting our dataset to defendants with a foreign background, judge age had a substantially larger (2.8 days per year) and significant effect on the length of prison sentences. Below we show the effect of judge age on sentence length computed separately for a dataset of only native and only foreign background defendants, respectively.
We also computed the interaction effect between judge age and defendant foreign background but the interaction itself was not statistically significant.
While we believe the completeness of our dataset was unprecedented within the European journalistic context, our analysis comes with a number of limitations.
We cannot exclude the possibility that our data collection method introduced some selection bias into the dataset. While we have at least some coverage for every district court, district courts that upload a larger share of verdicts may differ systematically from district courts that upload a smaller share of verdicts. Hypothetically, district courts could also hide unfair treatment by failing to upload certain verdicts.
The Norwegian National Courts Administration receives reports from district courts on the number of cases they decide. The agency disclosed statistics on the number of cases heard by lay judges for the years 2022 and 2023. These statistics show a particularly large gap between our dataset and reported cases in the Haugaland and Sunnhordland district court.
When matching defendants and judges to demographic data, the process was vulnerable to typos in names and postal addresses within the verdicts, as well as recent changes of name or address. We also could not obtain all information on defendants that did not exist in the population register.
Our dataset only contains cases where lay judges are included. For certain categories of cases, like drunk driving, a proportion of cases — typically less serious cases concerning a blood alcohol content below 0.5 — are assessed by a judge and therefore are not part of our material.
It is also possible that the severity of crimes within a section differs systematically by demographic groups. We attempted to account for this possibility by including aggravating and mitigating factors, but those do not necessarily entirely account for the severity of a crime. For example, while women may receive shorter sentences for theft, the average value of the goods they steal may also be lower. Reading verdicts also shows that there can be qualitative differences between crimes that are difficult to render as data altogether. At the same time, when we analyzed a restricted dataset containing only defendants convicted for driving under the influence that included variables like a defendant’s blood alcohol percentage our results around defendant income were still statistically significant.
Extracting aggravating and mitigating circumstances with a combination of regex and OpenAI’s ChatGPT also comes with pitfalls. While we benchmarked using a manually labelled test set, it is possible that ChatGPT misclassified aggravating and mitigating circumstances in some cases, or even generated inaccurate outputs unrelated to the input data (a phenomenon known as hallucination).
Our regression analysis assumes that each section under which a defendant is convicted is associated with a set punishment, and that each mitigating or aggravating circumstance is similarly associated with a set increase or decrease in punishment. This assumption is unlikely to hold in every case. For example, a confession in a murder case might result in a much larger reduction in prison time than a confession to drunk driving (at least in absolute terms). Reassuringly, however, our findings are robust to controlling for the interaction between every section under which a defendant is convicted and a binary indicator for the presence of a mitigating or aggravating factor (in addition to the sections and the binary indicator themselves).
Finally, it is important to acknowledge that our analysis is restricted to a relatively narrow question: Given a set of convictions, do defendants’ and judges’ characteristics lead to differences in sentencing outcomes? But the criminal justice system does not begin and end with sentencing. From police interactions, to arrest patterns, prosecutorial charges, and release decisions, there are many critical decision-making points at which the state can fail to ensure impartiality.
Building our dataset began with extracting the data from the PDF verdicts into a database. Each judge has their own way of writing a judgement, but phrasing around certain sections, like charges and sentencing, is relatively standardized. We used regex searches, which can recognize patterns in text, to obtain the charges and convictions in the case, as well as the names of the defendants and judges.
The date of birth and address were not available for the lay judges, but we could match the names with a public list from the Norwegian Courts Administration that contains the year of birth and postal code.
Obtaining the age and address of both defendants and judges enabled us to obtain both financial and demographic data about them.
Once a year, Norwegian authorities publish a national tax list. The tax list contains the total net income and tax paid for every Norwegian resident. We used a combination of name, year of birth, and postal code in order to match defendants and judges with their corresponding data in the tax list.
Norway’s Population Register provides journalists with demographic information about Norwegian residents. To make a query, you must be able to uniquely identify one person – a name alone is not sufficient. However, the service accepts a combination of name and postal code.
The Population Register allowed us to collect demographic information about defendants and judges. This includes the country of birth, which would allow us to analyze the effect of foreign background in the judicial system.
However, country of birth is a blunt approximator of perceived “foreignness.” In our material, there were several defendants with very common Norwegian names who were born outside of Norway. These could be children of Norwegian parents who lived abroad, for example. Likewise, other defendants are likely second generation immigrants who were born in Norway, but have parents born abroad.
To capture some of these nuances, we created four different categories based on combinations of country of birth and name. To create this combination, we used Statistics Norway’s list of the 2,000 most common girl and boy names in Norway. We manually reviewed the list in order to refine it. For example, some names that are not traditionally “Norwegian-sounding” but are nonetheless common were removed, as they likely indicate a foreign background.
a. Persons born in a Nordic country with a common first name in Norway.
b. Persons born in a non-Nordic country with a common first name in Norway.
c. Persons born in a Nordic country with a first name that is not common in Norway.
d. Persons born in a non-Nordic country with a first name that is not common in Norway.
This is not a perfect way to define foreign background, but it provides a nuanced representation based on the available information. We ran our analysis multiple times with various definitions of native and foreign background based on the four categories listed above, but did not find substantially different results. We ultimately marked defendants in category A as native background, in category B as undefined, and categories C and D as foreign background.
We decided to use Large Language Models (LLMs) to find mitigating and aggravating circumstances in the verdicts. We collected all paragraphs within each verdict where the Norwegian words for “aggravating” or “mitigating” were mentioned. To avoid sending sensitive information to OpenAI, we removed all names and dates from the paragraphs. Then, we sent each paragraph one by one to OpenAI’s API. We used OpenAI’s GPT-4 language model.
We asked the language model to identify the mitigating or aggravating circumstances in the paragraph and to respond with the type of circumstance it identified. The model was instructed to choose the circumstance that matched from a list of different types of mitigating or aggravating circumstances. If it did not find a circumstance that matched the list, it was supposed to respond with “other circumstances.”
The classification of mitigating and aggravating circumstances by GPT-4 was not perfect. However, after benchmarking the machine-generated classifications against a hand-coded random sample of 100 sentences, we were convinced that it was accurate enough for the task at hand.
To reduce the number of unique circumstances, we grouped the classifications made by GPT into 36 unique groups roughly corresponding to the paragraphs of sections 77 and 78 of the Norwegian criminal code.
We calculated a number of different model specifications. We computed models with varying levels of controls: no controls, all demographic variables, and demographic variables plus dummy variables for individual sections and aggravating and mitigating circumstances.
In addition, we also used several different approaches to estimating our models.
1. A complete dataset with prison time set to zero for defendants who did not receive a prison sentence.
2. A dataset restricted to only defendants who received a prison sentence of at least one day.
3. The same dataset as 2, but with a logged version of the dependent variable (prison time). This allows for the interpretation of coefficients in percentage terms.
We also computed negative binomial models with the complete dataset as a robustness check. Negative binomial models can account for the over-dispersion of zeroes (i.e., defendants who were not sentenced to any prison time) and the right-skew of the dependent variable (i.e., most defendants received a rather short prison term).
Nonetheless, it is possible that we failed to account for certain confounding factors. For example, we did not account for any legal changes that may have occurred during the period we collected data. We also did not have access to certain demographic factors that could also be associated with sentencing outcomes, like whether the defendant has children.
Our biggest concern, however, was with omitted variables related to the severity of crimes. We ran formal sensitivity tests for omitted variable bias using R’s sensemakr package. As a benchmark, we used the aggravating or mitigating circumstance most strongly correlated with our demographic characteristic of interest. The sensitivity test allows us to check how much of the unaccounted variation in our independent and dependent variable a potential confounder would need to explain in order to drive the independent variable’s effect to zero or reduce its significance level. We focus on the sensitivity results for models using the restricted dataset and logged dependent variable.
Results from the sensitivity tests indicate that a confounder of equal strength to the most correlated aggravating or mitigating circumstance would not drive the effect to zero for any of our independent variables for which we identified significant effects. However, for defendant gender, a confounder of approximately equal strength would increase the p-value enough that our results would no longer be significant. For both defendant gender and income, “repeated offense” is the aggravating or mitigating circumstance with the highest correlation. It seems implausible to us that there could be another confounder as strongly correlated with both defendants’ demographics and prison time that would not feature in our list of aggravating or mitigating circumstances.
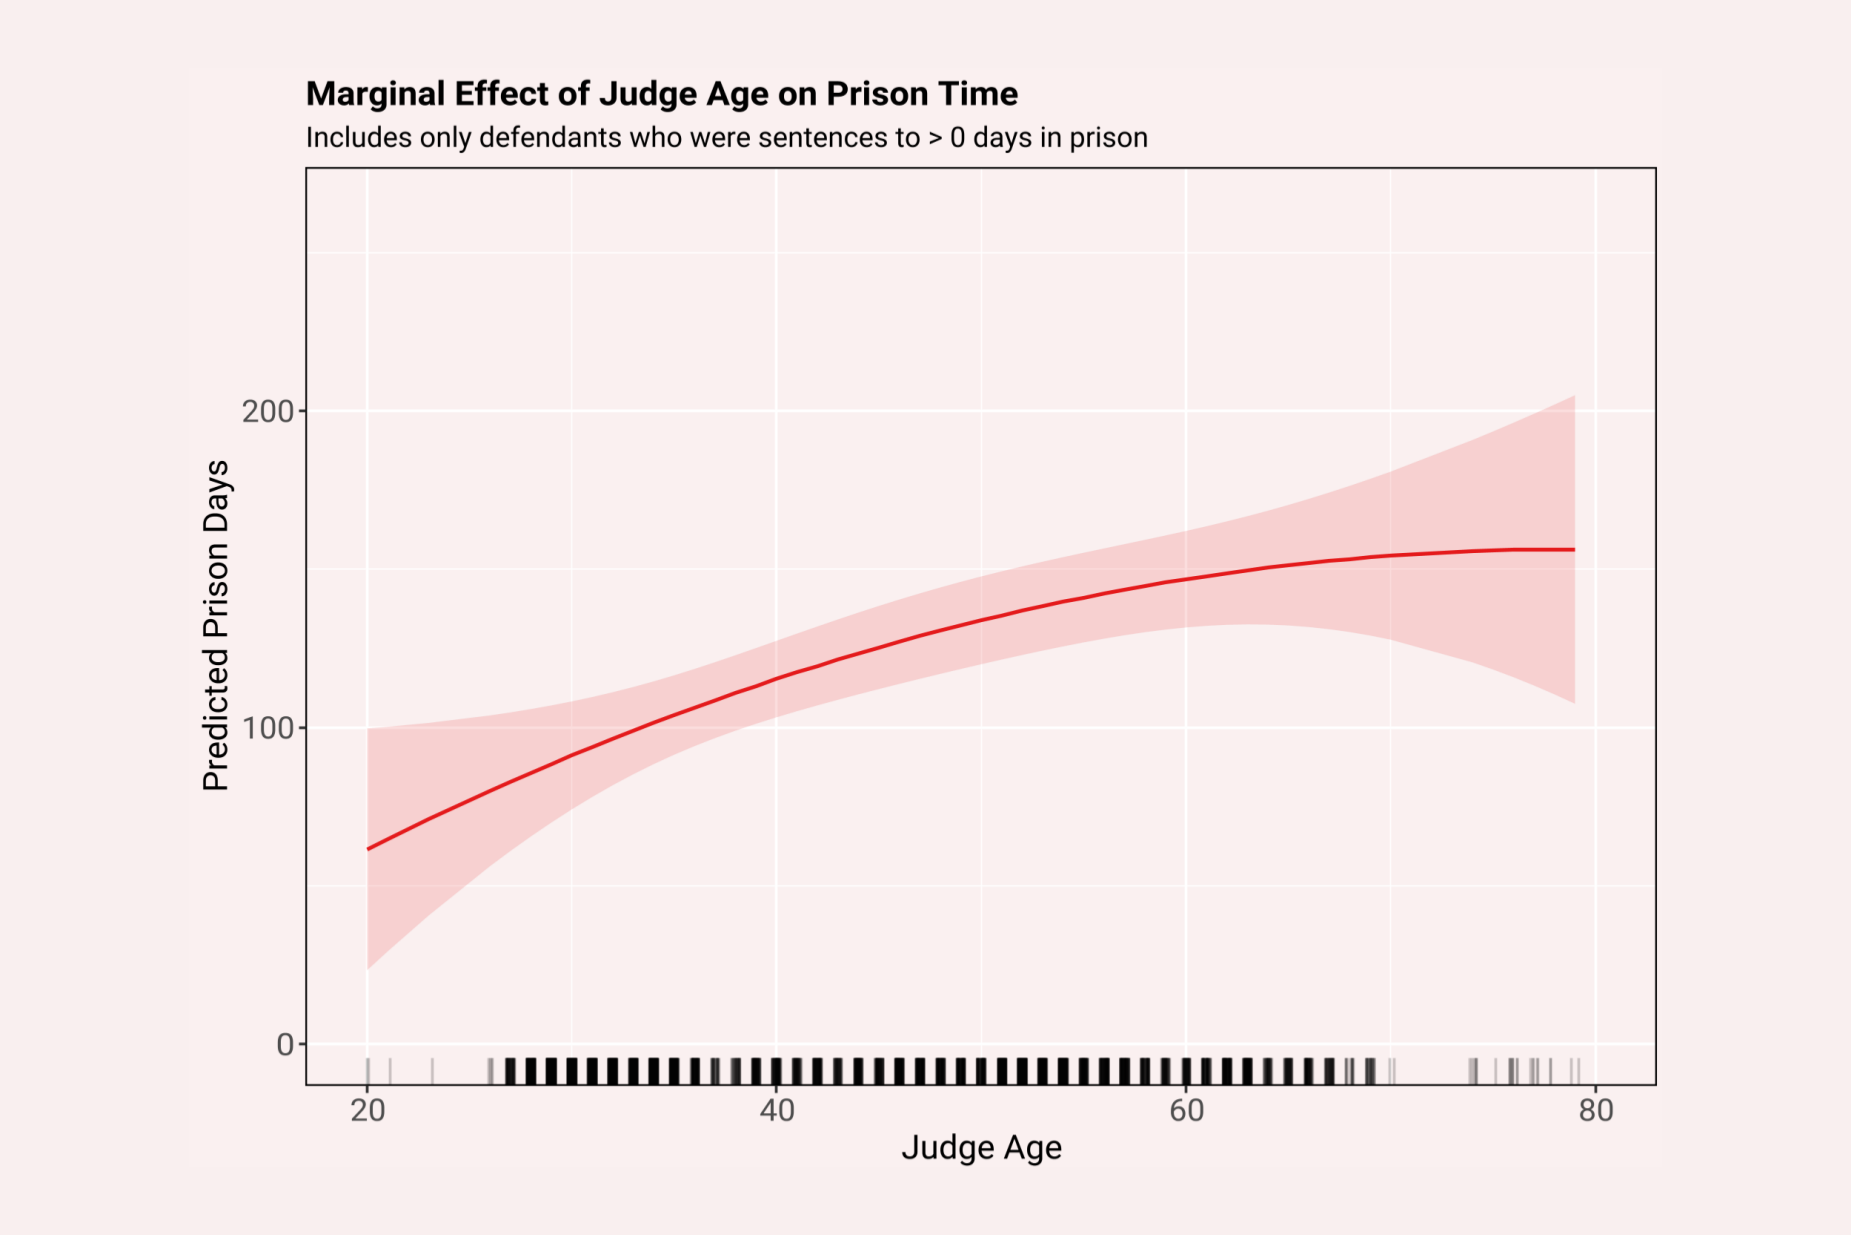
We also carried out a number of robustness checks relating to judge and defendant age. We only report results for a linear age term even though a squared age term is commonly added. When adding a squared term for defendant and judge age, we found that for defendants the sentencing pattern did follow an inverted U-shape. For judges, meanwhile, the age effect appeared to be relatively linear even when a squared term was included up to approximately age 70. Our dataset only contains seven judges older than 70, and these judges only decided 34 cases. We therefore chose to stick with the linear term given its ease of explainability. For judge age, F-tests let us reject the null hypothesis that the coefficient for both judge age and judge age squared is zero at the p < 0.01 level.
Judges below the age of 45 are typically ‘acting judges’ who do not have permanent positions and cannot handle cases with a sentencing frame over six years. We only have thirteen cases in our filtered dataframe, which excludes rare crimes like murder, with a sentence longer than six years. Still, in effect, this means that judges above 45 are more likely to receive crimes with longer potential punishments. While controlling for individual sections should account for these effects, we implemented additional models where we allowed the impact of judge age to be discontinuous at age 35, 40, 45, 50 or 55. The discontinuity was not significant for any of the models and by and large the positive linear effect of age was preserved.
Finally, we also checked for multicollinearity in our main model specification. While a few of the variables related to criminal sections are highly correlated with each other, none of the demographic variables of judges or defendants has a variance inflation factor (VIF) greater than 1.5, which suggests that multicollinearity should be of no concern in our findings.

