
Drownings and Deterrence in the Rio Grande


– More drowning deaths than previously reported. According to our data, at least 1,107 people drowned crossing the Rio Grande between Texas and Mexico between 2017 and 2023, a figure substantially higher than previously documented.
– Deaths peaked in 2021-2022, years when the number of people crossing was rising and Texas tried to seal its border with Mexico in an initiative called Operation Lone Star.
– The deadliest stretch of the Rio Grande between 2017-2023 was between the Mexican state of Coahuila and the Texas counties of Kinney, Val Verde and Maverick, which includes the city of Eagle Pass, which has been described as “ground zero” for Texas’ Operation Lone Star.
– In 2022 and 2023 the river was more deadly for women who made up one in five drownings. In 2023, one in ten deaths were of children. There were also more drowning victims from countries outside of Mexico and Central America in those years.
– Incomplete official data in both the US and Mexico leaves hundreds of deaths uncounted. No single agency in Mexico is comprehensively documenting migration-related deaths. Meanwhile, our data shows that the U.S. Customs and Border Protection (CBP), the U.S. agency mandated to document migrant deaths, has been severely undercounting drownings in the Rio Grande. The CBP recorded 498 water-related deaths in Texas and New Mexico from 2017 to 2023 while our investigation documented 858 migrant drownings in Texas alone during that time.
The Rio Grande river stretches for 2,000km along the Texas-Mexico border and has long been an important crossing point for those seeking to enter the United States. Since 2021, Texas’ multi-billion dollar initiative to police the border, called Operation Lone Star, has potentially made that crossing more dangerous.
In the middle of the river between Piedras Negras in Mexico and Eagle Pass in Texas, migrants now face a floating 300 metre-barrier of buoys equipped with serrated metal blades and completed with an underwater net. This corridor has seen more drownings than any other part of the river since 2021.
Texas has also installed 160 kilometres of razor wire along the river bank since the launch of Operation Lone Star, including at least 45 kilometres around Eagle Pass, potentially hindering rescues and trapping migrants in the water for longer, until they find a gap in the wire.
The militarisation of the border under Operation Lone Star isn’t limited to these physical barriers. In 2023, a state trooper claimed that superiors ordered officers at the border in Eagle Pass to push migrants, including children, back into the Rio Grande.
Until now, a full accounting of drownings in the Rio Grande has never been documented. No agency on either side of the river is comprehensively counting all deaths. The U.S. Customs and Border Protection (CBP) maintains a national database, but a 2022 report by the U.S. Government Accountability Office revealed that the agency was undercounting deaths as it failed to document all incidents as required by law.
The U.S. Customs and Border Protection only publishes aggregated figures from its database, greatly limiting the potential analysis by researchers, humanitarian organisations and other actors seeking to gain insights into the dynamics and evolution of the border. Meanwhile, authorities in Mexico do not systematically track migration-related drowning deaths.
We sought to fill a gap in public knowledge about the scale of the drowning deaths. The Washington Post, El Universal, and Lighthouse Reports spent a year in an effort to collect data from every Texas county and Mexican state that lines the river for the years 2017 to 2023. Against the backdrop of increasingly tightening immigration policies and enforcement, we wanted to understand whether drowning deaths have increased in the Rio Grande.
Our objectives were to collect more complete personal information about victims, understand the demographics trends, fill in the gaps in reporting on both sides of the border, and examine where possible patterns correlated with Operation Lone Star, to improve accountability for both incomplete data and lack of transparency and establish accountability for harm caused by Operation Lone Star.
We also wanted to know who the victims of the river and Operation Lone Star’s sometimes deadly tactics were beyond the aggregated numbers published by the U.S. Customs and Border Protection. By collecting and looking at data on individual cases we hoped to restore a bit of humanity and meaning to hundreds of often nameless deaths.
While the political narrative around Operation Lone Star often focuses on fighting the cartels, preventing drugs from entering the United States and arresting smugglers, we hoped to paint a more complete picture of those who drowned.
Our first task in acquiring data was to create a source map to identify all the authorities in Mexico and the U.S. that collect reports or data on drownings in the Rio Grande. Our source map was based on consultations with academics and experts as well as our own research. For example, we consulted with professor Stephanie Leutert at the University of Texas-Austin, an expert on migration at the Texas-Mexico border and co-author of the 2020 report Migrant Deaths in South Texas. This report informed our data collection methodology, while Leutert also shared data with our team and reviewed our methodology.
The source map included authorities at the local, state, and national levels:
– For local data, we listed all municipalities along the border on the Mexican side and counties on the U.S. side. This also meant identifying all the different types of local officials that might hold reports or data about drownings. In Mexico this was the municipalities’ Protección Civil offices, while in the U.S. we listed all the sheriff’s offices, medical examiners, Justices of the Peace, fire and police departments, etc. along the border. In total we identified 153 different local authorities to contact.
– At the national level, we identified the Mexican Secretariat of Foreign Affairs and the National Institute of Migration in Mexico, and the U.S. Customs and Border Protection (CBP), the U.S. Coast Guard, the National Oceanic and Atmospheric Administration, and the International Boundary and Water Commission in the U.S.
– For state-level data, we included the Attorney General’s Offices in the four Mexican border states and the Texas Department of Public Safety in the United States.
This level of detail was necessary because – while we already knew that drowning data from national agencies on both sides of the border was incomplete – during an initial audit of data previously collected by researchers it quickly became clear that local authorities often had partial data for their areas that was never fully consolidated as well.
For example, different bodies (such as police departments and medical examiners) in the same geographic area often reported overlapping data but both bodies also had cases missing. We realised that we could not rely on a single local authority to provide comprehensive data for their local area, so we would need to collect data from multiple types of official bodies and crosscheck it.
As part of reviewing the scope of our source map, we called the fire and police departments located along the border on the U.S. side to establish if they responded to calls in the river. On the Mexican side we consulted with reporters familiar with the area to establish which municipalities were likely to hold data.
We also initially agreed to collect data from 2012 to 2023. The start year of 2012 was chosen because of a significant increase in apprehensions and expulsions of unaccompanied minors crossing the border, which could also allow us to investigate the effects of policy changes during three different presidential administrations.
After this review, we established the following standards and processes for contacting the identified sources:
– For sources where no data had been previously collected, or where key data fields were missing, we submitted public information requests and FOIAs covering the entire period and all necessary data fields.
– For sources where data had already been partially collected and there were cost constraints in requesting the same data again, we only requested information for the missing years.
– If we didn’t receive a response, we followed up with phone calls, and where possible, made in-person visits.
In total we submitted requests to 165 different authorities in Mexico and the United States. Ultimately, after going through all the steps above, including 25 in-person visits, we obtained information including data from 52 sources.
In the case of the Webb County medical examiner, who initially refused to provide any reports but was identified as a critical source due to performing autopsies for nearby counties like Maverick, Zapata, and Val Verde, we explored alternative ways for obtaining the data.
Eventually, we obtained this data from a source who had reports for cases up to September 2022, collected during an in-person visit to the medical examiner’s office. Unfortunately more recent data from that source could not be obtained due to the prohibitive cost as Webb County’s medical examiner is now charging $25 per report to access that information.
Since the data obtained from the various authorities came in different formats and layouts, all information was manually entered into standardised spreadsheets with consistent layout, structures, and column headers. Clear instructions were provided for entering information into each data field, and an ID system was created to assign a unique identifier to every individual case.
We also needed to clearly define what we considered a confirmed drowning. Since our focus was on the risks faced by migrants crossing the river, we included all cases where the cause of death occurred directly as a result of an attempt to cross the river.
This included individuals who did not die at the river but in the hospital and in cases where drowning wasn’t the immediate or final cause – such as cases where a cardiac arrest triggered by drowning led to death in the hospital. One case in 2016 involved a baby of 30-31 weeks gestational age that died as a result of the mother’s drowning. The medical examiners report said it was unclear if they were a foetus or an infant who was born alive and we decided to include both mother and child in our data.
However, we excluded cases involving U.S. nationals as well as cases where bodies were recovered with signs of potential criminal involvement, such as gunshot wounds or mutilation.
A key aspect of data entry involved matching the descriptions of locations to actual geographic coordinates wherever possible. Incident reports from sheriff’s offices, police departments, and fire departments often used colloquial terms, referencing local landmarks, former place names, or even ranch owners’ names—details that wouldn’t appear in Google Maps or other online sources.
To address this, the data team reviewed the names of these locations with reporters who had travelled to these areas. This helped identify and assign coordinates to most locations.
In cases where the geo-coordinates were estimated by us rather than provided in the official reports, a special note was added to those cases. If a location was too large (such as ranches that can span over 10 miles along the river, beyond our deduplication threshold—see Preprocessing and deduplication section), no coordinates were assigned.
Once the data was entered, an initial 10% of the data from each source was spot-checked, with someone going again over each datafield for any input errors to ensure accuracy. If errors were found, more cases in that dataset were checked.
With all data standardised into a uniform format, we conducted a series of validation checks to ensure consistency in data types and formatting for the age, gender and date related data fields. We also reviewed unique values and spelling variations in fields such as nationality, city, county, state and country to ensure accurate deduplication.
The lack of a centralised data source for each geographical area necessitated seeking out the same data from multiple sources, making deduplication a crucial part of the process.
We relied on 15 data fields for deduplication:
– first name
– last name
– age
– gender
– nationality
– recovery da
– recovery month
– recovery year
– latitude
– longitude
– city
– county
– CBP sector
– state
– country
The deduplication script we wrote prioritised cases with the most known (non-blank) data fields, which gave us the highest confidence in their uniqueness. These cases were added first to a deduplicated list.
Each subsequent case was then checked against the deduplicated list. When checking if a case from the list was a match, we checked the new entry we’re trying to add against all the known (non-blank) data fields from that case, if the new entry and the case from the list contained the same value then the data field was marked as containing duplicates. See the Deduplication flowchart below for a more visual description of this process.
For the names, date and geographic coordinates further conditions were applied, so that an exact match wasn’t necessary to identify duplicates. See the Conservative deduplication rules for specific data fields section below for a description of how we controlled for potential data variations in these fields.
If all deduplications data fields were flagged as duplicates, then the two cases were considered to be a match. If a match (or more) was found, the new entry we were trying to add was added to a separate list of potential duplicates instead, along with a note of the cases from the deduplicated list that caused it to be excluded.
Cases which were removed with only a single potential match in the deduplicated list were reviewed individually. Other cases which were removed after being matched with more than one case from the deduplicated list were occasionally reviewed if they included characteristics that could be considered of special relevance to our analysis, like if they involved a child.
Since cases from the same source would have already been deduplicated during data entry, they weren’t compared against each other during the automated deduplication process.
We adopted a more aggressive deduplication approach for the data fields below, as we preferred excluding more cases than fewer to ensure that our figures represent a conservative count and avoiding risk of overstating the true scale of drowning deaths.
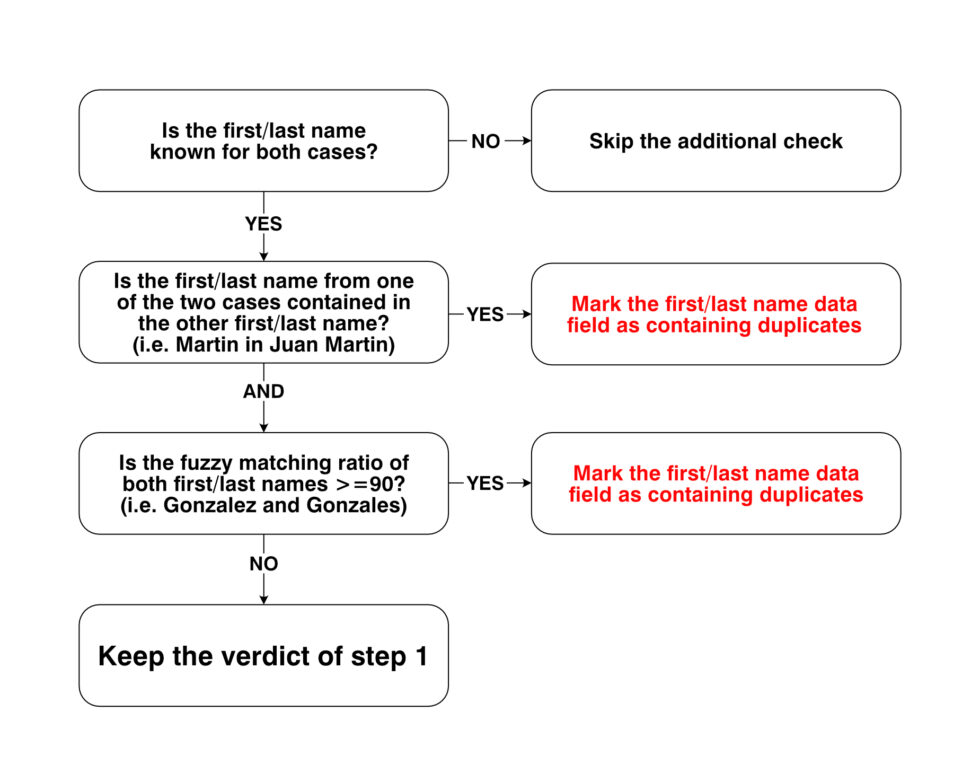
First and last names: We applied two tests when comparing names. First a substring test, checking if one case’s first name was part of another case’s first name and vice versa (e.g. Leo matched Leonardo or Martin Leonardo). Second a fuzzy matching test, checking if the fuzzy ratio between the two first names was 90 or more – generally corresponding to a Levenshtein distance of up to 2. If any of the two tests were passed, the names were considered to be a match. The same rules applied to last names.
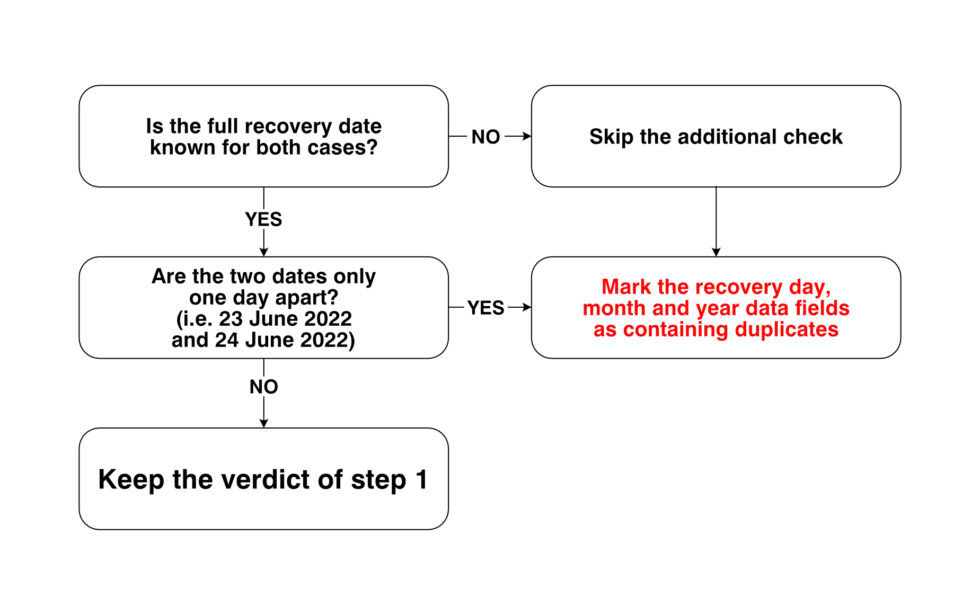
Recovery date: Dates from different sources occasionally varied by a day, for instance when a body was reported late at night by one authority and recovered the following morning by another. Dates that were one day apart were considered potential duplicates.
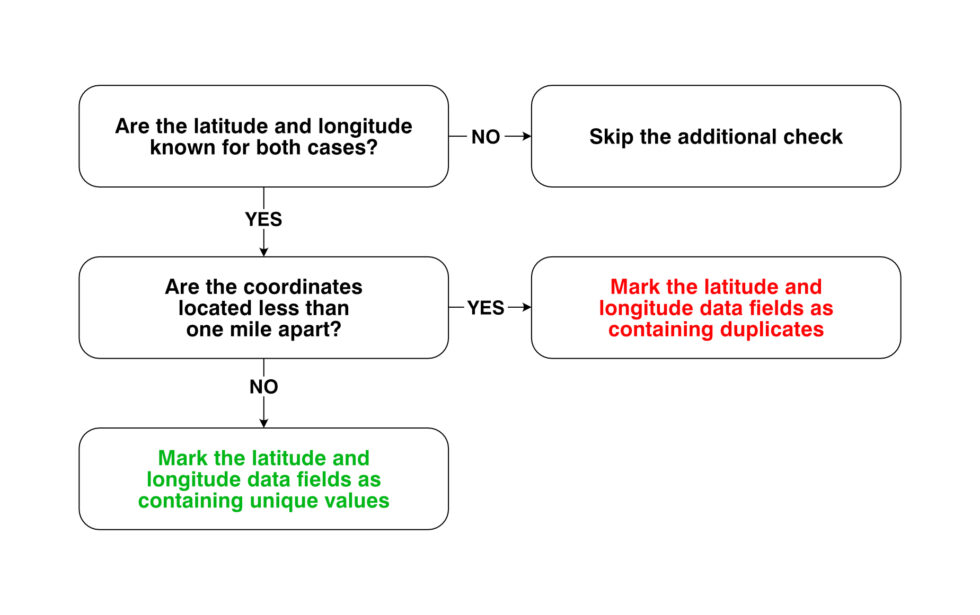
Latitude and longitude: We applied a 1-mile radius to coordinates, considering any pair of coordinates within this distance as potential duplicates.
1. General check for all 15 deduplication data fields
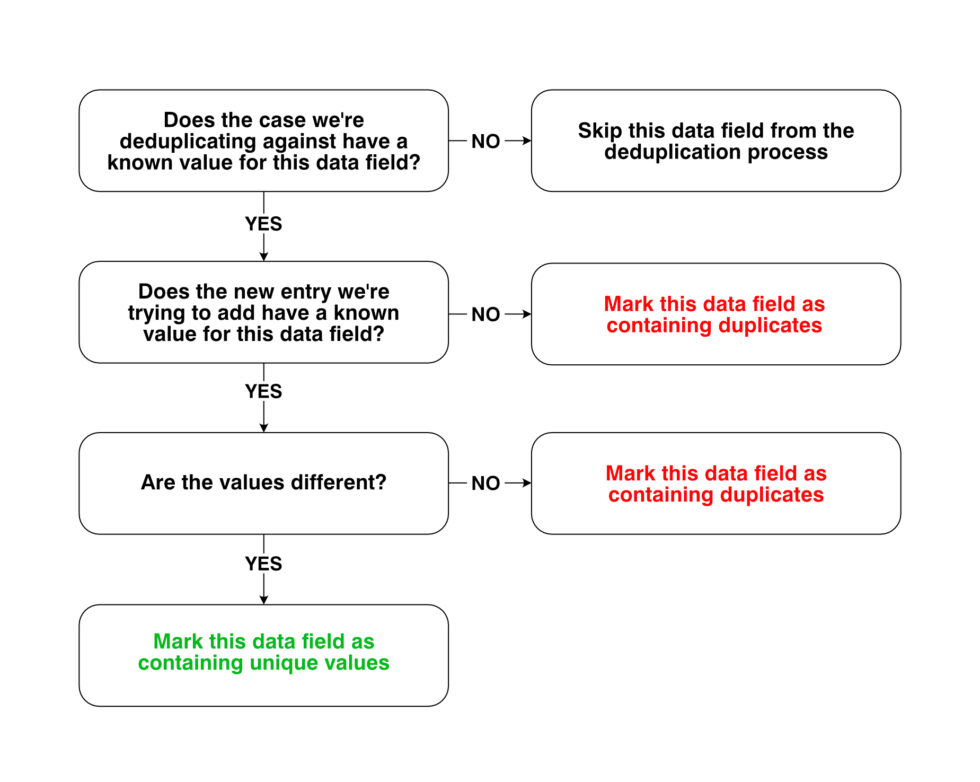
2. Special checks for first and last names, recovery date and geographic coordinates (See Appendix).
3. Establish whether the two cases are a match
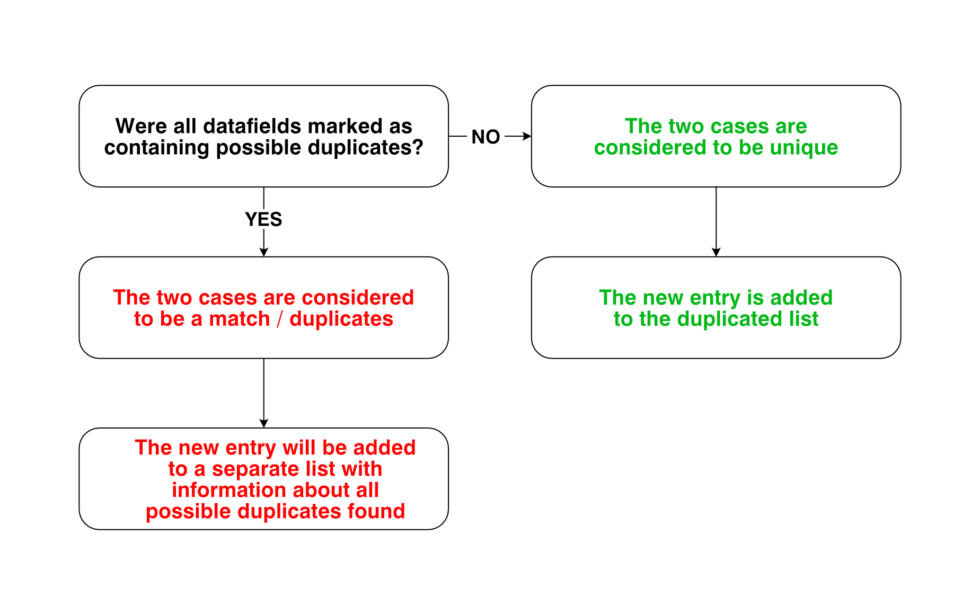
Given the complexity of this data collection, achieving perfect deduplication from the outset was impossible. These special rules were refined over time, as missed duplicates were identified during the analysis phase.
In many cases, duplicates were missed not due to errors in data entry or deduplication processes, but because of inaccuracies in the original data. Misspellings, incorrect ages, and errors in geographic coordinates (such as confusion between decimal and degree notation) were common. Some coordinates were placed along roads where officials had been dispatched, rather than at the actual recovery site.
When such cases were identified, we spent significant time returning to original reports and comparing the information from the different sources to determine which data was correct.
For example, if a name was spelled differently across reports, we favoured the spelling in more official sources, such as a death certificate, over those in incident reports from fire or police departments.
When such cases were identified, we corrected the information directly in the data entry sheets – making note of the correction – and re-ran the data cleaning and deduplication scripts.
While many of the corrections would still be caught by the various tests described above, correcting the data in the entry sheets helps ensure that we end up with accurate information in our final dataset and that where preventable we wouldn’t be negligently misnaming individuals.
Having obtained data from 52 of the 164 potential sources we had identified, the most important limitation was the number of sources who either did not track or keep records of drownings, charged prohibitive fees in order to access the information or simply refused to answer.
While we did not expect every authority to provide data for all requested fields, where demographic data, complete dates, or precise locations were missing this likely led to some cases being removed during deduplication due to insufficient information to confirm their uniqueness.
Although we identified the lack of response from some authorities as the main limitation, it is also possible that we missed potential sources. This combined with the factors mentioned in the paragraphs above may have contributed to an undercount of drowning deaths.
Although these challenges were all encountered in the United States, data availability and completeness were particularly problematic in Mexico. Neither of the two federal agencies we contacted – the Mexican Secretariat of Foreign Affairs and the National Institute of Migration – were able to provide usable data, offering only annual totals for the entire border between Mexico and the United States. Additionally, the municipality of Juárez, a key population center along the Texas border, did not provide any data.
The one county in Texas that stood out in terms of the data availability was Cameron. We obtained data from the county’s Sheriff’s office, forensic pathology office and the Brownsville police department, but after deduplication, these authorities only provided data on 20 individual cases from 2017-2023. This is far lower than the 142 cases recorded in the neighboring county of Hidalgo, even though the Brownsville-Matamoros metropolitan area is one of the most populous on the US-Mexico border.
In terms of completeness, decedent age was included in just 16% of the cases for which we obtained data in Mexico, and the only source to provide geographic coordinates was the municipality of Miguel Alemán, which contributed data for just three cases.
To assess the scale of this issue, we benchmarked our data on child drownings against that collected by the International Organization for Migration (IOM) through media monitoring and official reports. Media reports often reference when a child’s body is found, even if their age is not determined and/or recorded in official datasets.
In the United States, we identified more child drowning cases than those reported by the IOM between 2017 and 2023. However, in Mexico, we collected data of seven child drowning deaths, whereas the IOM had evidence of 23 cases over the same period. This disparity underscores how the lack of demographic data on the Mexican side severely limited our understanding of who was drowning.
We evaluated the completeness of the data from each source by looking at three key metrics: the percentage of cases with age data, the percentage with geographic coordinates, and the time period each source covered.
While we were generally satisfied with having age and coordinate data for about 60% of cases in the United States – and in some cases, over 80% for some sources who provided reports on dozens of cases – we had concerns about the completeness of data for the full period we intended to cover.
While some authorities provided data from 2012 onwards, others only supplied data starting in 2017. This posed a significant limitation, as inconsistencies in data availability across time would have made analysis over the entire reporting period challenging.
More broadly, this raises the concern that significant changes in data collection methods over time may influence whether observed trends reflect real changes or simply shifts in the agency’s methodology for recording incidents. To address these limitations, we narrowed our analysis to the period from 2017 to 2023.
We used data on drownings provided by U.S. Customs and Border Protection (CBP) to benchmark the quality of our data collection. Although CBP has faced criticism for undercounting migrant deaths, comparing datasets was valuable for assessing the completeness of our data acquisition.
If our counts were significantly lower than CBP’s for any given year or sector, we needed to evaluate our data collection approach and determine if adjustments were necessary to improve our benchmarking results.
Earlier comparisons with CBP data revealed a gap in the Laredo sector, which includes Webb and Zapata counties. Our numbers were significantly lower than what CBP reported. This prompted us to find alternative ways to obtain data from Webb County’s medical examiner.
The CBP data we used for benchmarking came from CBP’s Border Safety Initiative Tracking System (BSITS) data, which includes individual records of deaths and is not publicly available. The most complete version covering our entire analysis period of 2017 to 2023, was obtained by FOIA by Bryce Peterson from the Arizona-based humanitarian organization No More Deaths.
It’s worth noting that while we focused only on Texas, the El Paso CBP sector covers the Texas counties of El Paso and Hudspeth as well as the state of New Mexico, making a perfect one-to-one comparison impossible.
As shown in the tables below, our data collection figures match or exceed those of CBP in every sector and year, except for 2017. This indicates that despite the limitations discussed above and while gaps may exist, our broader methodology has allowed us to identify more cases, offering valuable insights into the true scale of these incidents.
This benchmarking seems to support previous reports from the Government Accountability Office (GAO) indicating that while CBP is mandated to record migrant deaths in the U.S., they have significantly undercounted drownings, particularly in El Paso, Rio Grande Valley and Del Rio sectors.
Overall, the CBP recorded 587 drowning deaths on the southwest border) 2017 to 2023 and 498 in the CBP sectors covering Texas and New Mexico. However, our data included 677 cases in Texas alone – at least 179 more cases than the CBP over this seven year-period. (After adding CBP’s case to our dataset and deduplicating — see below — we documented 858 drownings in total in Texas).
After completing the benchmarking, we integrated the CBP BSITS data mentioned above into our analysis, using the same methodology described earlier for deduplication.
We originally relied on various files covering different time periods which had to be joined. Some files were obtained through FOIA requests by Stephanie Leutert, a researcher from the University of Texas, while others were acquired by our reporters through similar requests. Additionally, one file was sourced from a MuckRock request submitted by journalist Gabriela Villegas.
We compared the content of these files and the data obtained by No More Deaths between them and against annual CBP figures to ensure their completeness and accuracy.
Despite having more cases than CBP in most sectors and years, there were still many cases recorded by CBP that were not captured in our data collection efforts. In total, 181 more cases were added to our analysis with the inclusion of CBP BSITS data. This gave us the final dataset from which the tables below are generated.
At least 1,107 people drowned crossing the Rio Grande between Texas and Mexico in the seven years from 2017-2023, a figure significantly higher than has been previously reported.
Drowning deaths peaked in 2021 (178 drownings) and 2022 (267 drownings) compared to the rest of the seven year period. These years also coincide with an increase in apprehensions and the start of Operation Lone Star in March 2021.
The number of reported drownings fell to 156 in 2023 even though apprehension numbers remained similar to 2022. It is unclear why that is the case, but it coincided with the introduction of appointment scheduling to enter the United States through the CBP One app and increased legal pathways for Cuban, Haitian, Nicaraguans and Venezuelans nationals through the CHNV program.
One anomaly stood out in the 2023 numbers: the stretch of river between Piedras Negras in Mexico and Eagle Pass in Maverick County, which has become the focal point of Texas’ militarized Operation Lone Star enforcement. Around 60 people died in Maverick County in each of the years 2022 and 2023 (54 and 47 of them in Eagle Pass in 2022 and 2023 respectively), making it the deadliest stretch of river along the entire Texas-Mexico border in those years.
It’s worth noting that while not covered by our data collection, figures for the 2024 financial year obtained from the CBP via FOIA show a rise in the number of drownings, reporting 100 cases for the 2024 financial year compared with 55 for 2023, suggesting that drownings are increasing again.
Typically, May through August is the deadliest time to cross the river, at a time when hurricanes, monsoon rains and water discharges from some dams along the Rio Grande are more likely. But unusually, November was the deadliest month for drownings in 2023. with almost every case around Eagle Pass.
Looking more closely at the 22 drownings that took place in November 2023, we first noticed that 16 happened in Maverick county (with 5 more cases in the Del Rio Sector that couldn’t be mapped to a specific county) and that all bodies in Maverick were recovered between the 14th and 30th of November.
Extending the time frame a little bit, we notice that two more bodies were recovered in Maverick on the 1st and 2nd of December, meaning that 18 drownings were recorded in Maverick in a span of 19 days from November 14 to December 2. The dead include five children – three boys and two girls – as well as four adult women. At least six deaths were of Venezuelan nationals.
The fact that neither our team nor the CBP found any records of any drownings for May 2020 is also of note.
Research organisations regularly use apprehensions as a proxy for border crossings. In general, research has shown that more crossings correlates with more deaths. However, our calculation of the rate of drownings per 10,000 apprehensions varies across different locations.
Overall, this rate was higher between 2017 and 2020, meaning that during periods of lower crossing numbers, the rate of drownings was actually higher compared to 2021-2023. The year 2017, the first year of the Trump Administration, was particularly deadly in relation to the number of apprehensions, although we have not been able to identify specific reasons for this.
It should be noted that while apprehensions offer a relatively reasonable proxy for border crossing it is not a perfect metric as changes in recorded apprehensions could be impacted by shifts in surveillance or enforcement practices at the border rather than actual migration flows. Also, it should be noted that apprehensions refer to events, not necessarily unique individuals.
The proportion of women drowning was highest in 2022 when it was nearly 22% and remained high in 2023 at 19%, meaning around one in five deaths were of a woman in those years, compared to around one in 10 between 2017 and 2021.
Even though the sample size is small, available data shows that more than one in eight drowning involved a child in 2023, the highest proportion in our 2017-2023 analysis timeframe.
Drowning deaths of people from countries outside of Mexico and Central America increased in 2022.
“Other” includes people from Angola, Bangladesh, Brazil, China, Colombia, Côte d’Ivoire, Cuba, Dominican Republic, Haiti, Kazakhstan, Peru, Russia, Senegal, Sri Lanka, Syria and Uruguay.
The section that serves as the border between the Mexican state of Coahuila and the county of Maverick, has seen the highest number of drowning deaths between 2021 and 2023 with 220 cases. By comparison we found evidence of only 44 drownings along that stretch of the river during the three years from 2017 to 2019.
The areas with the most deaths along the river shifted west around 2019 on the US side of the border, from Rio Grande Valley to Del Rio corridor and (to a lesser extent) El Paso.
On the Mexican side of the border a similar - although not as pronounced - westward shift occurs in 2021 from Tamaulipas to Coahuila.
Looking at the US and Mexican data side by side, the difference between the low numbers in Chihuahua and the relatively high count found in El Paso county on the opposite side of the border is at least probably due at least in part to the fact that the Protección Civil office from Ciudad Juarez did not provide any information, so we had to rely on data from the Chihuahua State Attorney General alone for the area.
One of the original objectives of the investigation was to understand the relationship between drownings and Operation Lone Star, the effort by the state of Texas since March 2021 to seal the border with Mexico, including by erecting new fences, walls and other barriers. Some of this infrastructure is visible in satellite imagery, making it possible to map the new barriers and potentially establish whether they coincided – or possibly even caused – an increase in drowning deaths.
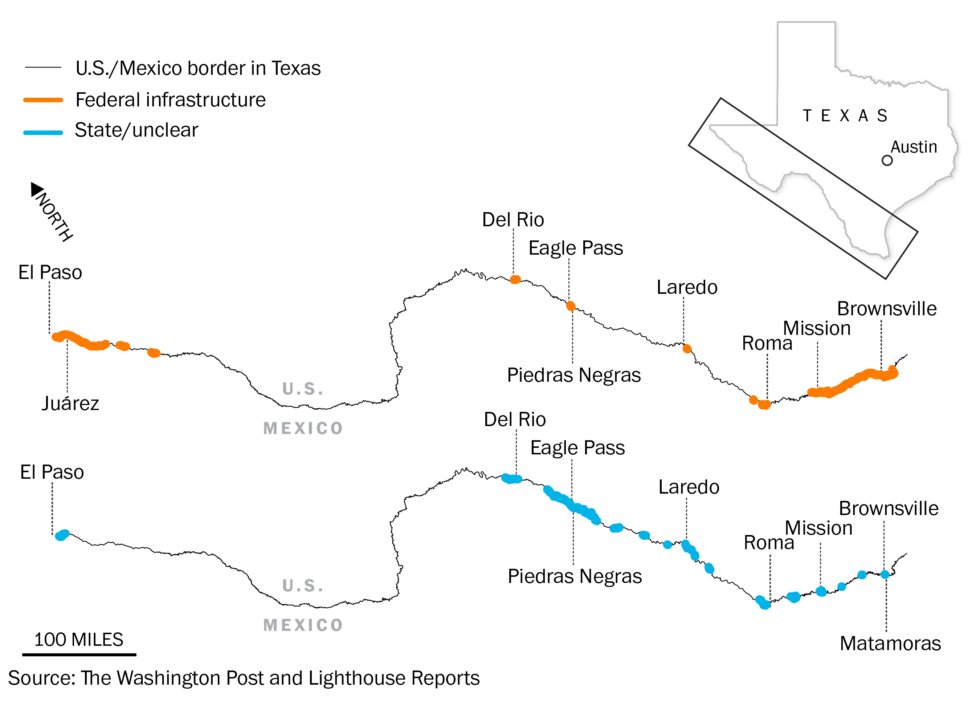
We plotted infrastructure using satellite imagery from Planet Explorer, Google Earth Pro and Maxar Technologies. We decided to map both the wall built by the federal government as well as barriers erected by the state of Texas in order to understand the impact of both on the frequency and location of drowning deaths. We began by plotting the federal wall using maps released by CBP which were verified with satellite imagery. We were able to distinguish between federal and state projects through cross-referencing satellite images with official statements and images as well as press reports and witness accounts. We compared satellite imagery from various dates to determine when each barrier was completed.
In total, we mapped nearly 250 miles of security infrastructure, including fences, federal border walls, containers, and a floating buoy barrier, along the Texas-Mexico border. Many other barriers such as concertina wire are not visible in satellite imagery and could not be mapped.
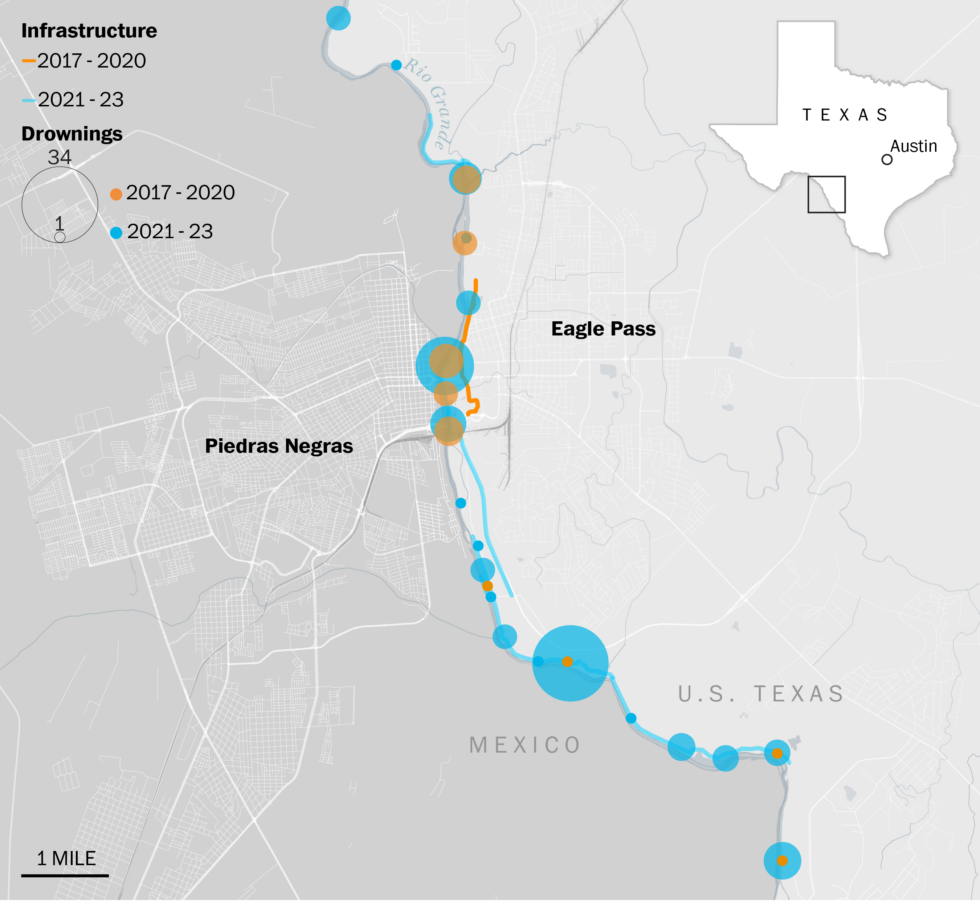
We then used the coordinates from the data described above to plot the locations where drowning victims were found between 2017 and 2023. The coordinates on the US side of the border had a higher degree of spatial accuracy, due to the way in which US authorities recorded and shared their data. Accordingly, our analysis of the impact of physical infrastructure on drownings focused on locations of bodies found on the US side of the border.
We focused our visual analysis on Eagle Pass in Maverick County because an increasing proportion of drowning deaths along the US-Mexico border have centered around this city over the last three years. By looking at the location of infrastructure and drownings in and around Eagle Pass over time, we found:
– Before 2021, most drowning victims in Maverick County were recovered near central Eagle Pass, particularly around Shelby Park. However, as more physical barriers were erected under Operation Lone Star, drownings spread further downstream.
– A large majority of the physical security infrastructure around Eagle Pass, including fences, barbed wire, and buoy barriers, was built after 2022.
– In 2022, around 40% of the drownings in Eagle Pass occurred near Operation Lone Star fencing around a pecan orchard farm a few miles downriver from Shelby Park, and in 2023, a third of drownings were also found in the same area.
– In the five years prior to its construction, seven people drowned within 360 feet of this fence; 34 people drowned in the same area in the two years following the construction of the barrier.
While changes in drowning patterns do coincide with the construction of new barriers in this case, it was not possible to establish a causal relationship without further analysis.
In addition to this analysis, we also tried to understand the relationship between drownings along the border and flow rate along the river, using data released by the International Boundary and Water Commission. While river discharge levels in other areas, such as the El Paso sector, show some correlation with drowning patterns, there is no such relationship in Eagle Pass.
In order to see if we could establish a causal relationship between the location of barriers erected by the US along the Rio Grande and the locations where drowning victims were found, we built out a pipeline to test this through various inferential statistical methods, including Granger causality tests and difference-in-differences (DiD) modelling.
We did find that drownings and the erection of barriers along the Texas-Mexico border are correlated with each other, however were not able to establish a causal relationship.
Our inability to control for the number of crossings at specific locations means that we cannot draw any definitive conclusions about causation, for example whether barriers increase deaths or whether barriers are erected in response to an increase in crossings, which is the actual cause of an increase in deaths.
As mentioned above, CBP apprehensions data is an imperfect proxy for crossings. It is only publicly released as an annual aggregate figure and divided geographically by Border Patrol sector, which spans multiple counties.
Without more granular data on the number of crossings at specific locations, it is not possible to tell whether increasing deaths are related to increasing crossings or not. The key takeaway is that finding better data on crossings – broken down more accurately by location and in time – is essential to answer these questions definitively.
– Special checks for first and last names
– Special check for the recovery date
– Special check for the geographic coordinates
We are grateful for the time and expertise of the following researchers and academics who contributed to the development of and provided input into this methodology. We would like to thank: Adam Isacson (Washington Office on Latin America) Stephanie Leutert (Robert S. Strauss Center for International Security and Law at The University of Texas at Austin), Bryce Peterson (No More Deaths) Sam Chambers (University of Arizona, School of Geography), and Geoffrey Boyce (School of Geography, University College Dublin).
The investigation relied on the work of many journalists and researchers who contributed reporting and assisted with data tasks, including: Jorge Luis Sierra, Geysha Espriella, Carola Briceño, Jason Buch, Michael Gonzalez, Priscila Cardenas, Justin Hamel, Cecilia Diaz and Jordan Lindbeck, Sarah Cahlan, Arelis R. Hernández, Nadine Ajaka, Christine Armario, Natalia Jimenez, Jonathan Baran, Junne Alcantara, Imogen Piper, Elyse Samuels, Miriam Ramírez, Paola Reyes, Alejandra Franco, Daniela Guazo, Silber Meza.